In October 2016, I interviewed Dr Andrew Turner, MONASS Advisory Board member, the the UK’s leading monsoon scientist based in the Department of Meteorology at the University of Reading. The following is a transcript of part of our interview:
LB: Tell me a little about your work on the monsoon here in the UK, Andrew.
AT: There is a close collaboration between the work I do here at the University of Reading and the UK Met Office. Over the years there have been several projects that we have done together on the monsoon. We run between here and the Met Office this thing called the Monsoon Working Group which was set up to try to do monsoon research here in the UK together in a better way. The main focus is on understanding the errors in the Met Office model related to the monsoon. Monsoon forecasting and prediction, as we will discuss later, is really not an easy problem to solve. A lot of people have worked for a lot of years on trying to understand these problems. The person I work with at the Met Office the most is Gill Martin who leads the Global Water Cycle Group. She is in what’s called the Hadley Centre. The Hadley Centre is a branch of the Met Office that ironically was founded by Margaret Thatcher to do research into climate change.
LB: Yes, we forget that she was very strong on climate change …
AT: … and that she was a trained scientist, in government, which is odd. She obviously saw the need for it and it was set up. It has been running since the 80’s … they have a substantial part of one floor of the Met Office building in Exeter and they have quite a number of staff.
LB: So the Hadley Centre is a climate change research centre?
AT: That’s right. It is basically for climate research. They have a model, the Hadley Centre Model, that they run for looking at climate projections of the future. This is one of the models that contributes to the IPCC. One of the things that comes up here that I need to mention is CMIP, the Coupled Model Intercomparison Project. Modelling groups around the world all contribute their models to that and it is, generally the models from this data base that are analysed in the IPPC reports.
LB: So there are multiple models that are interpreted.
AT: Yes, exactly, because one model is not going to give you the answer because of the various problems and the fundamental nature of the scientific problems of climate research. You can’t in a hundred years give account of the weather on a particular day in a particular county. The science does not work like that. So you need many models from which you can take an average.
One of the things the Met Office does is the weather forecasting for the UK. One of the interesting things about the science is, and perhaps we will talk about this a bit later, that the models are broadly the same for climate prediction and for weather forecasting. The main difference is the resolution. These models run on a grid, so, if you like, here’s a world map, with lines of latitude and longitude. If you imagine dividing that up at far finer spacings, that’s the grid on which the equations are solved, but it depends on the purpose of what you are doing. So if you are going to run a climate prediction, you perhaps are going to run your model for say 200 years into the future and then you’re going to want to look at the statistics for what happens in your typical January and look at what happens to the climate from now to then. Clearly to run a model like this for hundreds of years it takes a massive amount of computer power. You can change the amount of power by changing the resolution of the grid. Whereas for weather forecasting, which you are only ever running for three or five days ahead, if they can get that all to run overnight, then its ready for the next morning, and they can issue their weather forecast. So they can run it at a much much finer grid. Also, its not strictly necessary if they are doing the weather forecast to run the model globally. If you are doing a climate model however, you have to run it as a global model because so many different things interact with each other. With a weather model it is more a matter relating to the initial data you put in and the data at the boundaries of your blocks. So you could make a grid over the UK, which is what they do for one of their forecasts and they run those forecasts with a resolution of 1.5 kms, very high resolution actually. And that’s still a lot of computing power, but because they are only running it for a three days forecast, it is possible.
LB: Where are the main centres for monsoon forecasting and research in India?
AT: If we split this into research and forecasting, the Indian Meteorological Department (IMD) does three types of forecasting – day to day forecasting (the outlook for tomorrow), issuing agro-meteorological advisories, and the Seasonal Forecast (SF). The agro-meteorological advisories go into detail about whether, over the next period of time, we are thinking about this crop rather than that, or this variety, which fertilisers would be good and so on, and which pests can be expected – there will be some modelling related to that (temperature, rainfall, humidity will change the pest conditions in a certain way).
Their other major remit is issuing the SF. The monsoon season comes in June, July, August, September. The average start date for the monsoon is pretty much bang on the 1st of June in Kerala.
So around about the end of April, the SF is issued. The way that they do the forecast is that they take in evidence from other forecasting centres, like centres in the US that might be running a global seasonal forecasting model or equally the UK Met Office. The IMD looks at their models and says OK, the models say this, therefore we will forecast this in our report. Another institute in India, the IITM also runs these models and do a forecast using a derivative of one of the American models (the CFS, Coupled Forecasting System) that comes originally from NOAA. But they’ve adapted the model and changed it a bit to suit their environment.
The other major thing the IMD do is to issue a Statistical Forecast. This goes all the way back to the 1880’s. This is not a model. What a model is, what people use the word model for varies a lot. If an economist talks about a model, it is essentially a theory, and economic theory. If a climate modeller talks about a model it’s a computer program that will have of the order of 200, 300, 400,000 lines of programming code – equations and so on. Very different. There is this other thing that weather forecasters use called the Statistical Model, which is much nearer to the economic model end of things. What a Statistical Model does is to look at weather conditions, often at quite large scales, for instance, at the Pacific Ocean and what El Nino is doing and then they say well we know how traditionally El Nino relates to the monsoon, therefore this particular parameter is suggesting that the monsoon is going to go in this direction this year. That’s the general idea.
This was the state of the Indian forecasting system a couple of years ago. There are all these regions around the world, they look at conditions in these regions, different things in different places. Here it might be sea surface temperature, here it might be snow cover. They look at those conditions in spring, April, just as they are about to do the forecast. They write down a number for that value and they plug it into their model. It is all based on past correlations of those things.
LB: That’s what Walker started to do in the 19th C, but without computers isn’t it?
AT: Precisely it. It’s an expansion on that. Walker just did it with one or two parameters. For Blanford it was the Himalayan snow cover. You can plug those data in and get out your forecast. Its very simple, it has essentially six variables and a series of equations that look like this (pointing to equation on screen) where this is the rainfall of the season, this x is perhaps the Pacific sea surface temperature or whatever, and this is a constant. The IMD have been researching this for a long time. Its good up to a point, but the problem is that between doing your forecast and the season staring, conditions might change. Also, if you look at this map again, I could very easily give you a physical reason that links temperatures in the Pacific, El Nino to the monsoon, likewise I could give you a physical reason why the snowfall cover of the Himalayas might change the monsoon, but if you look at this, why would something in the middle of the Atlantic off Spain influences the monsoon, its not clear.
This is all based on correlations and correlation is not causation.
There might be another reason for the correlation being there which is not a causative one. And so if this system fails in a given year, you do not necessarily know why it failed. 2002 was a great example. Suddenly, in July of that year, there was quite a small El Nino, but it developed quite quickly. This was because there was another thing that happened called the Madden Julian Oscillation (MJO), which affected the monsoon and that would not be in a seasonal forecast map because it is just so far ahead, you just would not be able to predict it. And so the IMD are trying to move away from this statistical forecasting and more towards a proper, it has various names, either a Dynamical Model or a Coupled Model. It is these models that the UK Met Office and NOAA are using. They are models that include the atmosphere and the ocean, based on physics, using physical equations on the grid. The UK Met Office produces one of these each week looking about three or four months ahead.
So that’s what the IMD do. They collate this information and they produce their Statistical Model, write Seasonal Forecast of about 10 pages in April, issue it, and it contains their prediction of how the monsoon will vary from its long period average that year. It is going to be 104% or 88% or whatever. Its interesting for India that the monsoon is actually quite stable. If a monsoon goes above 110% or below 90% of its seasonal rainfall, that is an unusual situation. That works out pretty much by definition. You know about Gaussian distribution?
So (drawing) if this is our normal position; there’s a thing with Gaussian distribution that within 1 standard deviation of the mean you have 64% of all cases (by the shape of this curve). So almost 2/3 in a Gaussian distribution are within 1 standard deviation of the mean, 18% above, 18% below. The Indian monsoon, the average rainfall is about 850mm per year (June to September), and this standard deviation, how much it typically varies on a year to year basis is only about 85mm either way. So that means that the 1 std. deviation actually turns out to be 10% of the seasonal rainfall total. But that is saying, because that is small, that the monsoon is actually quite stable. 64% of monsoons are within 1 std. deviation, that is +- 85mm from the norm across the whole country. So the IMD issue their forecast and say well we think that this year will be 104% of normal rainfall (that’s what they said for this year actually), which is well within that normal range. If it was above 10%, they would say we think this is going to be a flood year.
Another problem with India and the seasonal forecast though is that that’s a country wide viewpoint, the average. In Chennai, when that flooding happened, they weren’t interested in what the seasonal average was doing, it was about flooding. So in any given year, there are always parts of India that have more rainfall and less rainfall than normal, always places that have floods, always places that have relative drought in an agricultural sense. That’s just one of the problems with seasonal forecasting, it will never be able to answer those questions.
LB: Are extreme events unpredictable then?
AT: They can be, but then you also have to start to think about putting together different time scales for different purposes. So let’s say you know a climate forecast 50 years, 100 years into the future, that might be very useful for society to develop infrastructure to better cope with more flooding, more droughts, better water storage, better water transportation, that sort of thing, building bigger reservoirs, protecting houses. However, the seasonal scale is still important for crop yields. It gives an overview of crop yield over the whole season also, it can affect things like gold prices. Because Indian families often hoard gold, they pass it on between generations, so if there is a good monsoon, gold demand tends to go up. Its interesting. It affects steel as well, something to do with the shipping; steel and coal are carried in ships, but if the monsoon starts early, then, especially with the coal, it can get into the ship and make the coal damp, which affects the price. For farmers again, the onset day is hugely important. For if you can sow your crop at the right time, your yield will improve.
There’s one other graph to get this across to you, yes this one will do. So this is what happened in 2002 across the country as a whole, from May to September.
The red is what you would expect in a monsoon season. It kind of looked normal till you got to July and then with El Nino and the MJO, it dropped right off. This was a very bad year for agriculture; and the graph is averaged over the whole county, so individual places were even worse. Different years do different things, here is another case. There is physics behind why this is going up and down like this (it might be the MJO), so, what I am saying is that if you put all these forecasts together, they are of use. You can give this outlook, farmers can plan. But you need shorter time-scale forecasts to adapt to relative wet and dry periods within the monsoon. And that I would say, relating to one of your later questions – what research needs to be done on the monsoon – well everything, but this is one of the most important areas – improving the forecast for three weeks ahead for his sort of thing. For things like the flooding, it depends how long the event is. For forecasting those, we can be much more confident than trying to do three weeks ahead, which is difficult. But then you get into the whole area we discussed last week. We’ve got the forecast, but what does your individual village leader or state governor do about it. That brings politics into the equation.
In addition to the IMD, the National Centre for Medium Range Weather Forecasting (NCMRWF) does medium range weather forecasting out to the five-days or so time scale. They are a relatively small place in Delhi but they use the UK Met Office’s model, on a commercial basis. Another organisation which is a much bigger place is the Indian Institute of Tropical Meteorology (IITM) in Pune. They tend to do forecasting at these extended range timescales, for these active break things, and also out to the seasonal scale. They run one of the models that the IMD uses to say what’s going to happen.
LB: How is monsoon data shared around the world?
AT: Well, there’s two sorts of data. There’s the data used in climate models and that all happens through a body called the Earth System Grid Federation. It has a number of distributing computer centres around the world. It is led by a place in California called the PCMDI (Programme for Climate Modelling Diagnostics and Inter-comparison) which is based at the Lawrence Livermore National Laboratory. If you go back to the previous IPCC report which was related to the data called CMIP3, they were the only centre receiving data. All the data was sent there and they hosted it. One of the problems is that as climate models go on, they get to higher resolution, they get more processes in them, and they get much bigger data. To host it now is much more difficult to do from one centre because the data is bigger so they, the way they will do it now in CMIP5 and CMIP6 is that that data will be replicated at a number of centres and stations around the world so that if one, if I want to download some data, I will be able to look and see which is the heaviest loaded and avoid that one and go to a different one and get it from there. And all of that is free. In theory you could sign up and get this climate model data; you would not get any support for what to do with it but it is free. Its all open access. One of the data centres is in the UK. It used to be called BADC, the British Atmospheric Data Centre, but now its called Centre for Environmental Data Analysis, which is not far north of here in Rutherford. There is a Rutherford Appleton laboratory in the Chilterns which has a particle accelerator and they have a big data centre. So that’s data on the climate modelling side.
But then on the forecasting side, it really would just be looking on the web, at say the IMD’s Seasonal Forecast, and you look at the output and its generally not about looking at the raw data, its more at the graphs and the pictures. And often getting the raw data is tricky, especially if its not your own country’s. Things like satellite data, generally that’s freely available, you can Google that. The IMD, issue a few data products that they put on a grid. It might originally have come from a weather station; they have hundreds of weather stations across the country, they grid it, but generally its at a cost. Its at a higher cost for foreigners. The raw data from the IMD is extremely difficult to get hold of. So if you want rain gauge data from a particular place, its really, really hard.
LB: For gathering atmospheric data, are those cloud … those balloons still used?
AT: Oh yes, radio-sonde balloons … I’m just wondering if I’ve got any pictures I can show you here … are my pictures of balloons going to come up here? … The good thing about these balloons is that they give you very high frequency information, and high frequency in space about the vertical profile of the atmosphere. You launch them, the balloons are big enough … what happens when balloons go up is that they expand. Eventually as they get to the top of the atmosphere where the air is thin, they burst and then they will come down again on a parachute, because you don’t want to, you know kill anyone. So these are really useful because when you’re, globally there’s thousands of these being launched every day often twice a day, at 0.0 hrs UK time and 12.00 hrs UK time, and then they’re fed into forecasting centres and because, for weather forecast, you have to start with the current observed state of the atmosphere. If your observation is slightly wrong, that introduces an error, so if you imagine you’ve got your global model and its split up into this grid, for each of those boxes in the grid, you need one or more observation, and of course the grid is not just a grid at the surface, it is a grid all the way up, and you can imagine that over the ocean or over some desert somewhere, you don’t have any observations, either at the surface or in the atmosphere. So that introduces errors, so that’s one of the reasons why forecasts will deviate from what actually happens. Because they are not being given accurate initial conditions. So things like radio-sondes are extremely useful for things like that because you get a very accurate profile of the atmosphere going right up. So that’s for one purpose, for the forecast, but for our purposes, for the research, we can then look at the atmosphere, and we can look at the vertical profile in a climate model and say well, India in July looks like this but the model looks like this. So then its trying to understand the differences.
So that’s the weather balloons. There’s another thing called a Doppler weather radar, which is basically a radar that spins around, it sends out pulses and they’re reflected off raindrops, off moisture; they can give you good information about cloud structures, they can tell you if its raining or not; so they’re really really good … some of them can give wind information as well. They are very good for what we call “now casting” It sounds silly, but for instance for the Met Office, its really useful for them to know that it snowed somewhere, for they might not know unless someone or some instrument tells them, and that goes into the next forecast. So these are great for that. You can see where the rain has been or where the ground might be wet and so on.
Obviously they have other instruments as well, so automatic rain gauges, automatic weather stations, and they do all the other usual instruments.
LB: I am curious about the relationship between observed measurements and forecasting.
AT: The relationships between the observation and the forecasting is you know you need observations firstly to initiate your models but secondly to later look back at your models and see what’s wrong and why is it wrong.
LB: That you have to make informed guesses about?
AT: Yes, but also there’s a role in doing more experiments with models to try to understand why – if you change the way that let’s say the land surface feeds moisture to the atmosphere in a model, how might that change a forecast. And there’s two schools of thought. You could either randomly alter these numbers and parameters such that your forecasts are always getting better or you could actually understand the physics and therefore try to write a better model in the first place. Which is obviously what people should be doing.
LB: What climate models do you use?
AT: The main one we use is the Met Office one. It has various names. Generally, its called the Hadley Centre model, technical name HadGEM3. That will be the one that goes into the CMIP6 project eventually. So the way that people like me do things is that sometimes you run models yourself and then you might do a specific experiment and analyse the output, but on another occasion it might be that your looking at say 10 models from the CMIP archive and you‘re wanting to understand why are these models doing reasonably well for the monsoon, but these models aren’t, which is a very hard task, because once the models have been run, you then have no control and all the models are very different. Trying to understand, well these models have got this kind of common characteristic, but then this one does as well, but it was a bad monsoon, so yes, why? There are so many different things interacting. That’s why you need to have a single model that you can work on and try to change something and then try to understand why the monsoon responds in the way that it does. That is basically what happens in a lot of weather and climate forecasting research around the world. People trying to understand the response of the weather and the climate to the changes that they make in the model. And to relate it to physics, to real theory.
LB: What satellites are useful for monsoon science?
AT: Satellites have different channels. Obviously our eyes can see only what is visible to us, but then there’s another whole range of the electromagnetic spectrum. So one side of that, beyond red you get infrared, which is essentially heat, thermal heat. And so satellites can look at that because it does not matter if its day or night, they will see an image of the Earth. That can be very good for seeing the cloud tops and you can look at one of these images and they can determine the temperature of the cloud top and that will tell you what height the top of that cloud is. In a guessing sort of way because if its colder, the top of the cloud is going to be higher up. If a cloud top is higher up, and therefore it tends not to be a cloud like that (pointing out the window), but it tends to be a cloud like this, the thicker cloud, and in the tropics, that tends to be one that has more rain fall associated with it. So you can make some inference between the satellite images of clouds and the rainfall that might have happened. There is a big team here that does this for Africa; they’ve done this for many years, it’s a project called TAMSAT, and it relates the cold cloud duration or the length of time where you have these clouds with cold tops with the amount of rainfall. And the reason they do that is because of course historically there have not really been many rain gauges in Africa.
LB: So say that to me again. So you look at images of cloud cover, satellite images of cloud cover, and because you can read the temperature at the top of the cloud, you know its whereabouts in the atmosphere?
AT: Yes, so what is happening is that the instrument on the satellite is looking down and energy is being emitted from surfaces. Now if say you are over some cloud free desert region, the satellite will be able to see all the way down to the desert surface so it can give you an estimate of what the temperature of that surface is. But if there’s something in the way, like a cloud, its going to hit the cloud first and so it will report the temperature at the top of that cloud. And because the atmosphere gets generally colder as we go up, then it will tell you the temperature where they are and you can gauge approx. the level of the top of the cloud.
LB: And from that you can gauge how much rain that cloud has inside it.
AT: No, not what it has inside it, but the way that they do it here; they’ve statistically analysed previous images and how long … They’ve picked a particular region and they’ve looked at the time when there is this cold high cloud and they find that if those last for several days, then there’s a lot of rainfall, and if they do not last for very long then there’s not a lot of rainfall, and they’ve derived relationships over Africa for this, and then they can look at future satellite images as they come out every day, and ask what does this mean for the rainfall that we might expect over parts of Africa. There’s lots of complications because if you’re looking at the surface of the Earth through the atmosphere, there might be layers of dust, there might be pollution, so all of these things will disturb the measurement.
That’s just one sort of satellite. I’ve mentioned some terminology here. For the tropics, we are very much interested in the geostationary satellites; this hovers over single point and it will last for 10 years or something and then when it breaks they will have put a new one up anyway and its giving these infrared and visible and microwave channels, different sorts of measurements. There’s another sort called polar orbiting satellites, and they’re going round much faster and at much lower altitudes and they might pass over a particular country or a part of a country twice a day. The problem is that the passage that they do the next day is not going to be exactly the same as the one today, but they are much lower and they can give you much higher resolution things. They have for example one called TRMM (Tropical Rainfall Measurement Mission) and the GPM (Global Precipitation Mission). They have a precipitation radar on them, so that’s actually firing a signal, what we call an active instrument, its firing a signal and its bouncing back and what that radar you can probe different layers of cloud structures. You can see where in the cloud the precipitation is coming from and that sort of thing. So that’s their advantage, but because they’re moving around all the time, you cannot get say 1,000 samples of the same spot.
LB: What are the main areas of study for monsoon system scientists now?
AT: Difficult to answer, but a lot of the research is focusing on these time scales that we call subs-seasonal to seasonal. Its basically two or three weeks ahead because that seems to be the thing that is most useful for society. Another important element is that we often find that the errors that happen in weather models and climate models have strong similarities which suggest that if you solve them in the short time-scale models, they will also be solved in the climate models. So therefore you don’t necessarily need to be running things for hundreds of years to work on solving these problems. Which is an efficiency. I would say those two things are the biggest things at the moment.
LB: One of the key questions that I’m interested in is whether people who understand the weather talk to planners and visa versa. Or are these different scientific languages that never connect.
AT: You wonder – do they go and pick up the IPPC the other working groups papers? I think some of the most interesting work I did in the last couple of years was a very short piece of work we did with a student on the link between these weekly variations in the monsoon and potential wind power in India. We looked at how rainfall changed the wind in different regions and how therefore, there’s an equation you can change wind speed into power and it’s a non linear system.
LB: Finally, Andrew, what is your research about at the moment?
AT: We have recently run a field campaign called INCOMPASS that we have been planning for years. We installed towers which measure fluxes from the surface into the atmosphere at different sites. They are very useful for understanding models. This was my Indian counterpart installing one of these. It is at IIT in Kanpur. They have an old airfield and we installed some instruments to the top of their control tower. We also launched radio-sonde balloons from the airstrip and we have one of these towers in an agricultural field. This is one of the India stations that is doing one of these daily balloon launches. They fill their balloons with hydrogen, which is explosive, butts much much cheaper, because you can chemically produce it, though not safe. However, more significantly, we managed to take the UK’s research aircraft, which is based in Cranfield in Bedfordshire to India for two months. This is the aircraft (showing picture on screen). It’s quite big, it has four engines. It can hold about 20 scientists at once. We eventually got permission to fly it, tons of organisation, lots of people. We were based in Lucknow which is here and in Bangalore, here. From Bangalore we did flights due west, and then we did flights that came down here from Lucknow. It was from the middle of May till the middle of July. Basically the idea was to get in before the monsoon started and then as it was going and developing. This is a real flight we did from Bangalore … I could go on about this for hours. What I am going to be doing for the next few years is basically assessing this.
For Andrews’ blog on this campaign, go here.
Andrew will be speaking on this field campaign and early analyses of the data at our first symposium, Monsoon Assemblages Air on 21 April 2017 at the University of Westminster.
Lindsay Bremner, Interview with Dr Andrew Turner, University of Reading, 12 October 2016.
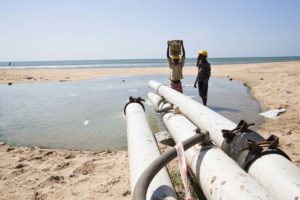
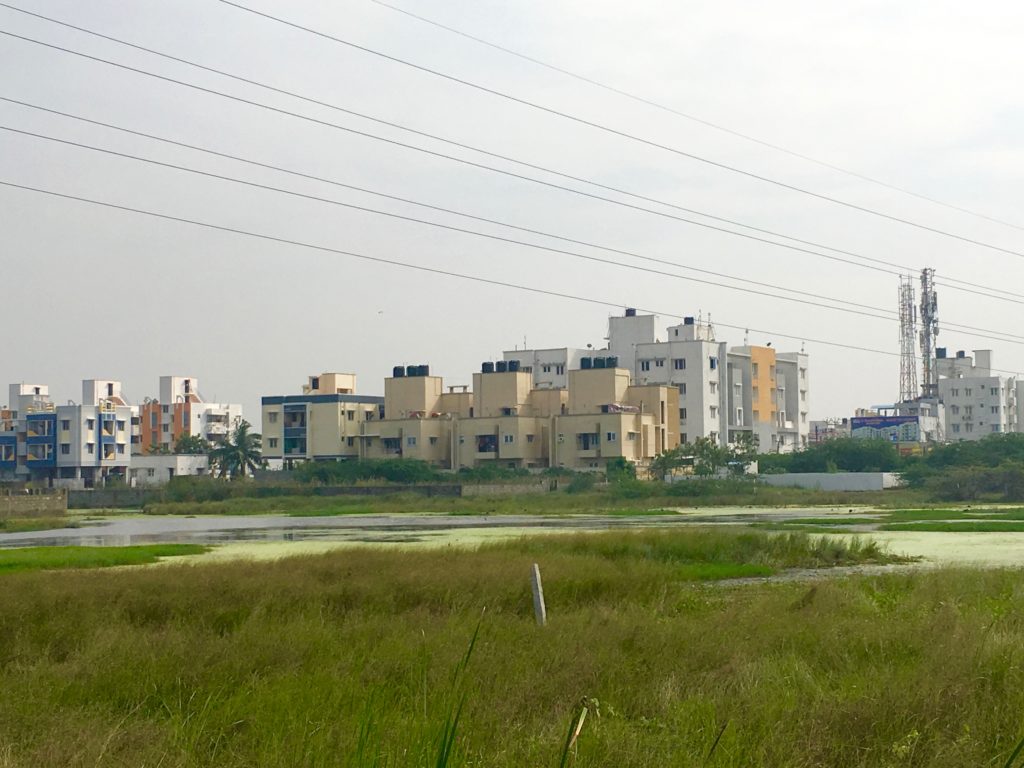 Southern reaches of the Pallikaranai Marsh. Photograph: Beth Cullen